Country announces plans to build world's first artificial energy island โ here's what you...
"The Princess Elisabeth Island project is a cornerstone for enhancing Belgium's and Europe's energy security and independence."
Electricity prices across Europe today reveal a significant range. Leading the list is ๐ท๐ธ Serbia with a rate of 0.181 โฌ/kWh. In contrast, the most affordable electricity rate is found in the North of ๐ธ๐ช Sweden, with a remarkably low price of 0.009 โฌ/kWh.
Prices in other parts of Europe, such as ๐ธ๐ฐ Slovakia at 0.17 โฌ/kWh, and regions of ๐ฎ๐น Italy at 0.16 โฌ/kWh, fall somewhere in between, showcasing the diverse cost landscape across the continent today.
Price area โ โฌ/kWh | Avg. | High | Low | |
---|---|---|---|---|
#1 ๐ท๐ธ Serbia | +41,5% | 0.181 | 0.314 | 0.111 |
#2 ๐ธ๐ฐ Slovakia | +25,5% | 0.170 | 0.237 | 0.109 |
#3 ๐ญ๐บ Hungary | +23,9% | 0.167 | 0.222 | 0.108 |
#4 ๐จ๐ฟ Czech Republic | +20,1% | 0.166 | 0.211 | 0.120 |
#5 ๐ง๐ฌ Bulgaria | +24,3% | 0.166 | 0.220 | 0.107 |
#6 ๐ท๐ด Romania | +24,3% | 0.166 | 0.220 | 0.107 |
#7 ๐ญ๐ท Croatia | +24,4% | 0.163 | 0.210 | 0.106 |
#8 ๐ธ๐ฎ Slovenia | +24,7% | 0.161 | 0.210 | 0.106 |
#9 ๐ฎ๐น Italy (Calabria) | +16,0% | 0.160 | 0.203 | 0.121 |
#10 ๐ฎ๐น Italy (Centre-North) | +16,0% | 0.160 | 0.203 | 0.121 |
#11 ๐ฎ๐น Italy (Centre-South) | +16,0% | 0.160 | 0.203 | 0.121 |
#12 ๐ฎ๐น Italy (North) | +16,7% | 0.160 | 0.203 | 0.121 |
#13 ๐ฎ๐น Italy (Sicily) | +15,6% | 0.160 | 0.203 | 0.121 |
#14 ๐ฎ๐น Italy (South) | +16,0% | 0.160 | 0.203 | 0.121 |
#15 ๐ฆ๐น Austria | +25,1% | 0.159 | 0.210 | 0.105 |
#16 ๐ต๐ฑ Poland | +28,7% | 0.157 | 0.238 | 0.100 |
#17 ๐ฌ๐ท Greece | +13,1% | 0.154 | 0.211 | 0.107 |
#18 ๐ฎ๐น Italy (Sardinia) | +7,1% | 0.148 | 0.203 | 0.000 |
#19 ๐จ๐ญ Switzerland | +13,7% | 0.145 | 0.216 | 0.114 |
#20 ๐ฉ๐ช Germany | +32,0% | 0.144 | 0.210 | 0.093 |
#21 ๐ฑ๐บ Luxembourg | +32,0% | 0.144 | 0.210 | 0.093 |
#22 ๐ง๐ช Belgium | +31,9% | 0.144 | 0.206 | 0.096 |
#23 ๐ซ๐ท France | +33,9% | 0.143 | 0.203 | 0.096 |
#24 ๐ณ๐ฑ Netherlands | +29,5% | 0.141 | 0.209 | 0.087 |
#25 ๐ต๐น Portugal | -1,9% | 0.140 | 0.160 | 0.121 |
#26 ๐ช๐ธ Spain | -1,9% | 0.140 | 0.160 | 0.121 |
#27 ๐ฉ๐ฐ Denmark (East) | +52,4% | 0.139 | 0.210 | 0.087 |
#28 ๐ฉ๐ฐ Denmark (West) | +71,0% | 0.132 | 0.209 | 0.087 |
#29 ๐ช๐ช Estonia | +39,3% | 0.103 | 0.183 | 0.008 |
#30 ๐ฑ๐ป Latvia | +39,3% | 0.103 | 0.183 | 0.008 |
#31 ๐ฑ๐น Lithuania | +39,3% | 0.103 | 0.183 | 0.008 |
#32 ๐ซ๐ฎ Finland | +765,9% | 0.100 | 0.183 | 0.008 |
#33 ๐ณ๐ด Norway (South) | +138,5% | 0.093 | 0.204 | 0.041 |
#34 ๐ธ๐ช Sweden (Mid-South) | +312,3% | 0.092 | 0.178 | 0.008 |
#35 ๐ธ๐ช Sweden (South) | +171,2% | 0.090 | 0.176 | 0.008 |
#36 ๐ณ๐ด Norway (East) | +85,2% | 0.070 | 0.138 | 0.030 |
#37 ๐ณ๐ด Norway (West) | +36,7% | 0.050 | 0.090 | 0.032 |
#38 ๐ณ๐ด Norway (Mid) | +128,0% | 0.027 | 0.045 | 0.008 |
#39 ๐ณ๐ด Norway (North) | +78,9% | 0.012 | 0.018 | 0.009 |
#40 ๐ธ๐ช Sweden (North) | +139,1% | 0.011 | 0.028 | 0.006 |
#41 ๐ธ๐ช Sweden (Mid-North) | +99,0% | 0.009 | 0.030 | 0.005 |
"The Princess Elisabeth Island project is a cornerstone for enhancing Belgium's and Europe's energy security and independence."
EADaily, December 2nd, 2024. In November, Europe burned a record amount of gas from storage facilities and entered the winter with the lowest reserves in the last two years. The price of fuel exceeds the pre-cr...
Temperatures in northwest Europe are set to slip below seasonal norms next week, a test for power systems as the continent taps gas storage faster than usual.
High levels of wind energy production helped average electricity prices across most major European markets decline during the third week of November, according to analysis from AleaSoft Energy Forecasting.
The largest battery energy storage system operating on Finnish electricity markets, delivered by Merus Power, has been completed and is now in market use. The energy storage facility, designed for Finnish cold...
High energy costs and bureaucratic hurdles are threatening Europe's industrial competitiveness and job market.
Europe's electricity market is characterized by a diverse array of energy sources. The main source of electricity across the continent varies by region, reflecting different geographical and economic factors.
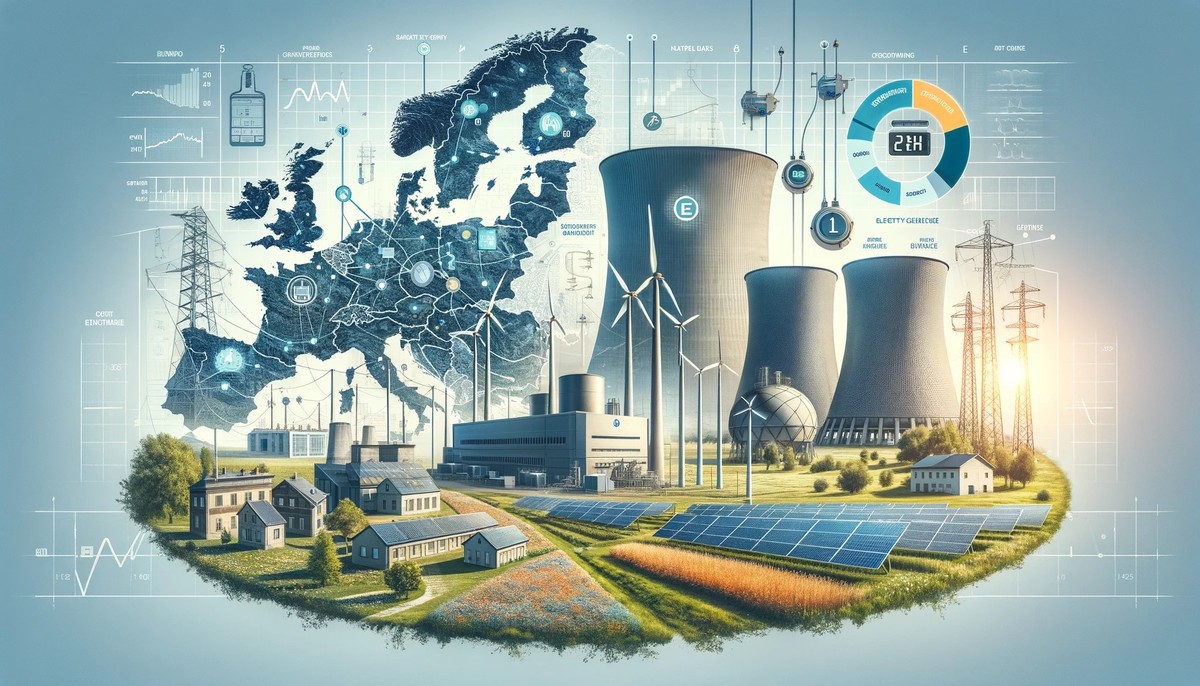
In many European countries, nuclear energy and natural gas are significant contributors to the electricity mix. Renewable sources like wind, solar, and hydroelectric power are also rapidly growing, reflecting the continent's commitment to sustainable energy.
Renewable energy is increasingly prominent in Europe's energy landscape. Countries are investing in wind farms, solar panels, and hydroelectric plants to reduce carbon emissions and combat climate change.
This shift towards renewables is driven by both environmental policies and technological advancements. European nations are leading the way in developing and implementing green energy technologies.
Following EU regulations, a significant number of households in Europe have installed smart meters. These devices provide detailed information on electricity usage, measuring consumption on an hourly basis.
Smart meters enable consumers to adjust their energy use in response to real-time data. Many European households have electricity plans that are linked to the current spot price, allowing them to benefit from hourly price variations.
Most European countries are part of a shared electricity market, which is facilitated by extensive interconnections between national grids. This integration allows for the efficient distribution of electricity across borders.
These connections enhance the reliability of the electricity supply and promote the use of renewable energy sources. They allow countries with excess renewable energy to export it to regions with higher demand, optimizing the use of green energy across the continent.
Europe faces challenges in balancing its energy supply, particularly with the variable nature of renewable sources. Ensuring a stable and continuous supply of electricity is a key focus.
Investments in energy storage technologies and grid modernization are critical in addressing these challenges. These advancements will enable Europe to maximize the benefits of its diverse energy mix.
kWh stands for kilowatt-hour, and is a unit that tells how much energy is used in one hour. Kilo means a thousand. So for example, if you have a 1000 watt oven on for one hour, you have used 1 kilowatt-hour. For a light bulb, which may only consume 10 watt, it will take 100 hours (just over 4 days) before you have used 1 kWh.
Most electricity companies in Europe buy electricity on a common market place, such as Nord Pool. All power plants that produce electricity and electricity companies that supply electricity to homes and businesses meet there. Based on supply and demand, prices are set for each hour and each area, one day in advance. Some countries, such as Norway, are divided into several different price areas, each of which has its own spot price.
Supply and demand determine the price of electricity in Europe. If there is a high production of electricity from power plants and demand is low, the price will fall. If, on the other hand, the production of electricity is small and demand is high, prices will increase. Therefore, the price of electricity is often highest in winter, as the need for electricity for heating is highest.
Heating certainly uses the most electricity, closely followed by hot water and charging electric cars. Electrical appliances such as TVs, mobile phones and computers use very little electricity in relation to heating.
All prices are current open market spot prices in the day-ahead segment without local vat, tax or other additions.
Timezone is Central European Time (CET) with Daylight Saving Time (DST). Current time: Tue, 03 Dec 2024 02:11
Data source is ENTSO-E